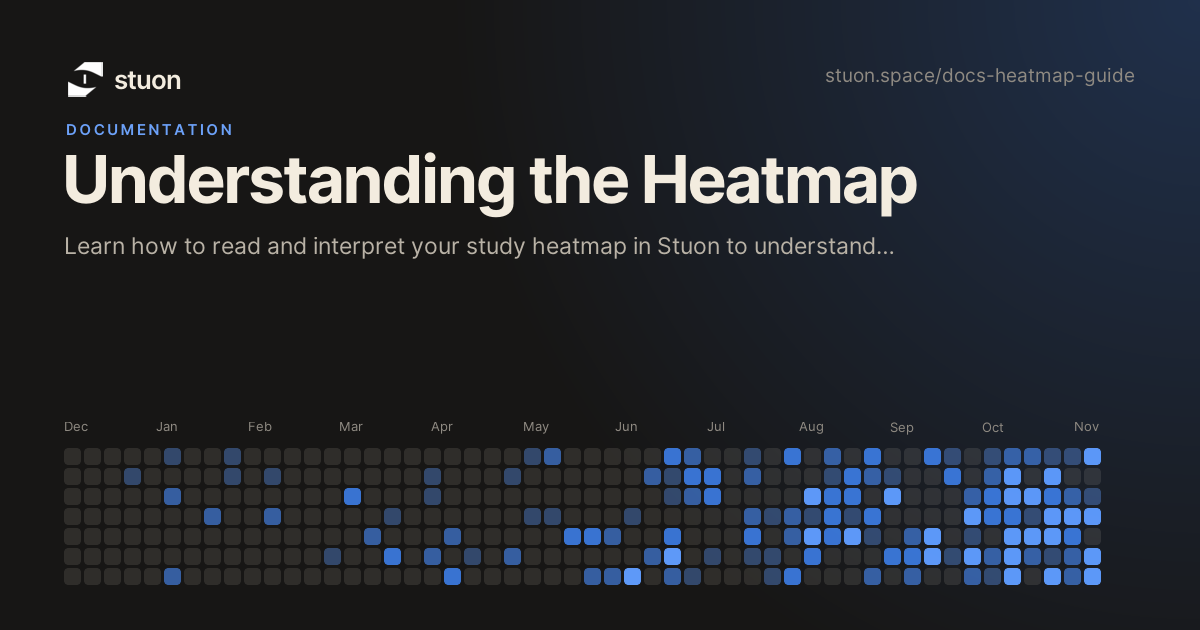
Stuon's heatmap provides a visual representation of your study activity over the past year, similar to GitHub's contribution graph. This powerful visualization helps you understand your study patterns and build consistent habits.
How the Heatmap Works
The heatmap displays 365 days of your study history in a grid format:
- Rows: Days of the week (Sunday through Saturday)
- Columns: Weeks of the year
- Colors: Intensity of study activity for each day
Color Coding
Each day is represented by a colored square that indicates how much you studied:
Reading Your Heatmap
Pattern Recognition
Look for these patterns in your heatmap:
- Consistency: Regular colored squares indicate good study habits
- Streaks: Consecutive days with activity show momentum
- Gaps: Dark periods may indicate breaks or challenges
- Intensity: Lighter colors show lighter study days, darker colors show intensive sessions
Weekly Patterns
Each row represents a day of the week. Look for:
- Weekday vs Weekend: Do you study more on certain days?
- Consistent Days: Which days of the week are most active?
- Rest Days: Are you taking appropriate breaks?
Using Heatmap Data
Goal Setting
Use your heatmap to set realistic study goals. If you see many dark squares, aim for more consistent light activity rather than trying to achieve white squares every day.
Progress Tracking
- Monthly Reviews: Check your heatmap monthly to see improvement
- Streak Building: Aim for longer streaks of consecutive study days
- Intensity Balance: Mix light study days with intensive sessions
Habit Formation
- Start Small: Even 5-10 minutes daily creates visible patterns
- Build Gradually: Increase intensity over time rather than trying to study for hours immediately
- Consistency Over Intensity: Regular short sessions are better than sporadic long ones
Heatmap Tips
Pro Tips
- Check your heatmap weekly to stay motivated
- Don't worry about perfect streaks - focus on overall consistency
- Use the heatmap to identify your most productive study times
- Share your progress with friends for accountability
Common Patterns
- New Year Effect: Many people start strong in January but fade by February
- Exam Periods: Intense study before exams, followed by breaks
- Summer Slumps: Reduced activity during vacation periods
- Weekend Warriors: Heavy weekend study to compensate for weekdays
Troubleshooting
Data Issues
- Missing Data: If sessions aren't appearing, check that you're logging them properly
- Incorrect Times: Verify your timer settings and session logging
- Display Problems: Try refreshing the page or clearing browser cache
Remember
The heatmap is a tool for motivation and insight, not judgment. Every colored square represents progress, no matter how small. Focus on building positive habits rather than achieving perfect patterns.
Frequently Asked Questions
Why is today's square still empty?
The heatmap only counts saved sessions. A session is saved when you stop the timer or when it finishes, so a timer that is still running does not show up yet.
Why does my heatmap look different on another device?
The free version keeps its data in the browser you used, so each browser has its own history. If you use Pro and sign in with the same account, the same sessions and heatmap load everywhere.
How do I see exactly how long I studied on a day?
Hover over a square in the free version to see the date and the time studied that day. A lighter square means more total study time that day.
Why did the same day change shade in Pro?
In Pro, each square is shaded relative to your busiest day in the range you are viewing. If you switch to a longer range that includes a bigger day, the other days look lighter by comparison.
Can I change the heatmap range, layout or color?
Yes, in Pro. Open the heatmap settings to choose the week start day, a grid, bar or line view, a single color or project colors, and a range from the last 7 days up to the last 365 days or a month-by-month view.