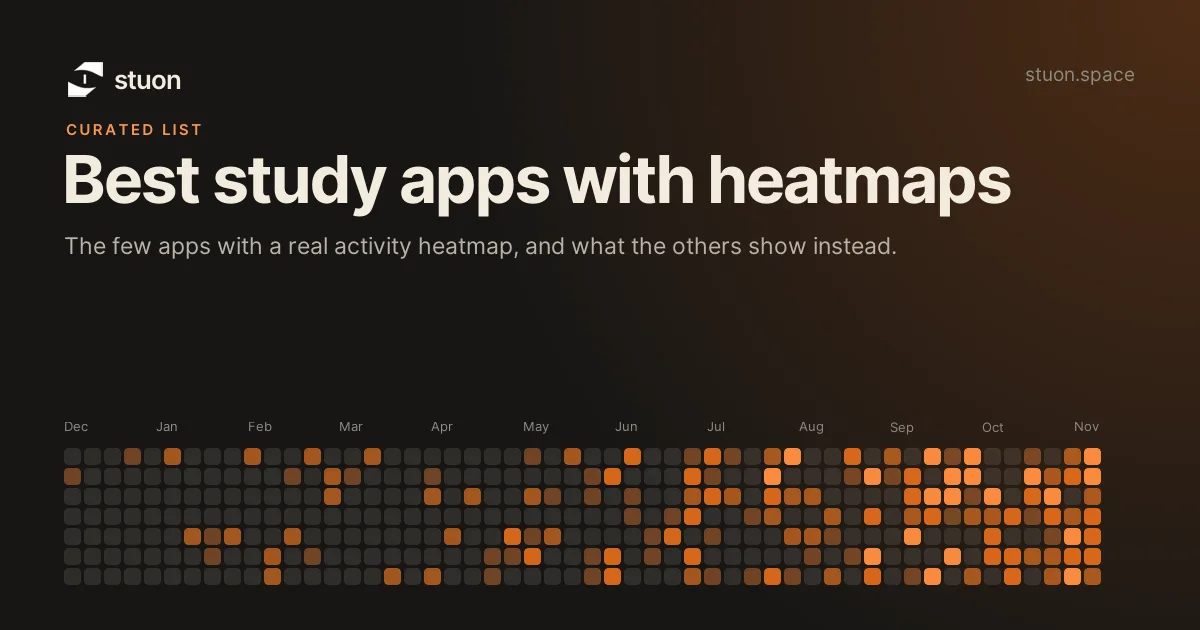
Few study apps have a true activity heatmap. TickTick shows a yearly focus grid, HabitHeat gives habits GitHub-style heatmaps, and Stuon builds a yearly heatmap from logged study sessions. Forest, Flora and Pomofocus show history in other forms.
by Vusal Imranliupdated 14 Nov 20264 min read
How these apps were chosen
It shows a grid of days where colour depth reflects activity.
It can show study or focus time.
The heatmap is documented on a public page.
We list apps that show something similar, but do not count them as heatmaps.
At a glance
Heatmaps and similar views
Criteria
Stuon
TickTick
Forest
Flora
Pomofocus
Streaks
Yes. Basic streak view in the free version.
Not documented.
Yes. Streaks appear in its stats.
Yes. The habit tracker gives a streak when tagged sessions happen on consecutive days.
Not documented.
Heatmap
Yes. The heatmap fills in from logged sessions.
Yes. Focus Statistics includes a yearly grid where colour depth shows daily focus time.
No heatmap documented. History is shown as a forest and a timeline.
No heatmap documented. Statistics are daily, weekly, monthly and yearly.
Not documented.
Analytics
Yes, in Pro: focus time, history and consistency.
Focus trend charts, timeline and most-focused times.
Basic analytics are free. Focus Analytics is part of Plus.
Daily, weekly, monthly and yearly statistics.
Visual reports of focus time. Some reports are Premium.
Apps with a heatmap
01 HabitHeat
A habit tracker that shows each habit as a GitHub-style heatmap, including timer-based habits.
best for
Students who want a heatmap for several habits, not only study.
Facts were checked against each app's public website or store listing on 7 October 2026. Prices and features change, so confirm on the official page.
Why we list so few
We only counted apps whose public documentation describes a heatmap or contribution-style grid. Others may exist, and some apps add features often. If you know one that qualifies, check its page and compare it with the criteria above.
Apps that show something similar
Forest shows finished sessions as a forest and a timeline.
Flora shows daily, weekly, monthly and yearly statistics.
Pomofocus gives visual reports of focus time.
These show history, but not a day-by-day colour grid, as far as their documentation says. You can also build a heatmap in a spreadsheet with conditional formatting.
What a heatmap tells you
A heatmap shows patterns that totals hide: gaps, bursts before exams and weekday habits. Read more in the study heatmap guide and try the demo. It pairs well with a study streak.
Frequently asked questions
What is a study heatmap?
A calendar grid where each square is a day, and darker squares mean more study time. See study heatmap.
Does Forest have a heatmap?
We found none in its documentation. It shows a forest and a timeline.
Can I make my own heatmap?
Yes, with a spreadsheet and conditional formatting. You must enter the minutes each day.