study tool
Study heatmap
what is a study heatmap?
A study heatmap is a calendar grid where each square is one day and its shade shows how long you studied. Darker squares mean more study time. It makes consistency visible at a glance: gaps, streaks and busy weeks.
by Vusal Imranli updated 14 Nov 20263 min read
- total
- -
- active days
- -
- longest streak
- -
- current streak
- -
Sample data, generated in your browser. Select a day with a tap or the arrow keys.
Keep a focus timer and site blocker in your Chrome toolbar.Add to Chrome, free
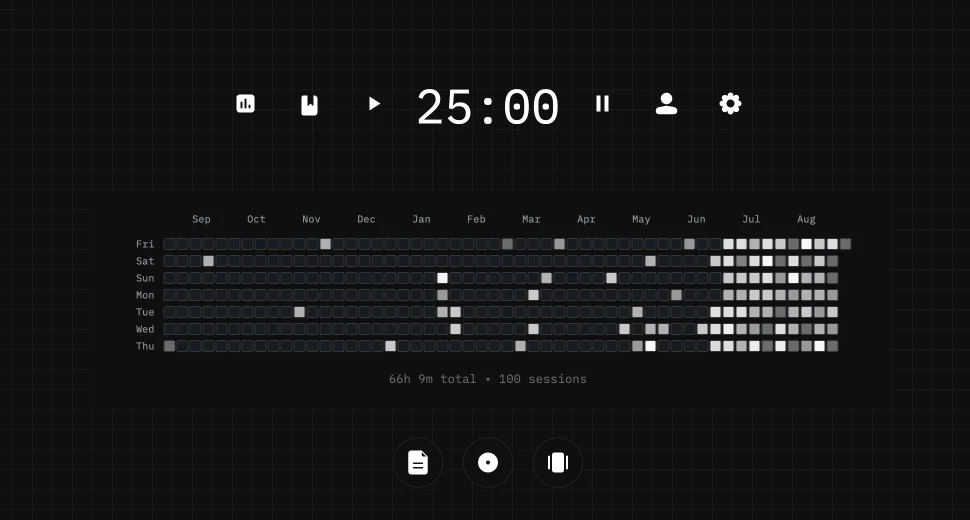
How to read a study heatmap
- Each column is a week and each row is a weekday.
- The shade of a square is the time studied that day. An empty square means no study.
- Look for gaps: a run of empty squares shows where the routine broke.
- Look for rhythm: if the same weekdays are always dark, you have a pattern you can plan around.
Why use a heatmap
A heatmap shows what you did, not what you remember doing. A skipped week that is easy to forget on a to-do list stays visible as a row of empty squares.
It also shows the shape of your effort over a whole term. That makes it easier to adjust the plan than a weekly total does.
Four patterns to try in the demo
- Steady
- Most weekdays are filled, weekends are lighter. A routine like this is easy to maintain and easy to track with a study streak.
- Exam crunch
- Little early on, then a steep climb. The risk is that the final weeks carry too much. Spreading the same hours earlier is the usual fix.
- Weekends only
- A few long days. Fine if it is deliberate, but long sessions need breaks, and weekday gaps give you no practice between sessions.
- On and off
- Bursts followed by gaps. A smaller daily minimum often smooths this out.
The heatmap in Stuon
In Stuon the heatmap fills in by itself. You study with the timer, each session is logged, and that day's square darkens. The free version has a basic heatmap and streak view. Pro adds analytics and more ways to view your data.
Related tools: the study tracker and the study hours calculator.
What Stuon users log
Aggregated and anonymised figures from Stuon. They describe how people use the app, not what works best for learning.
| Measure | Value |
|---|---|
| Median sessions per active week | 5 sessions |
Based on 145 Stuon users, updated 2026-10-12. Calculated from 4,316 aggregated Stuon sessions across users with at least 5 logged sessions. Excludes sessions under 5 minutes and known synthetic/test identifiers. An active week is a week in which a user logged at least one session. Aggregated, no individual data.
Frequently asked questions
What does a study heatmap show?
It shows how much you studied on each day, as a grid of squares shaded by time. Gaps and streaks are easy to see.
Is the data in this demo real?
No. It is sample data generated in your browser to show how a heatmap looks. Pick a pattern to see how different habits appear.
How do I get my own study heatmap?
Log your study sessions consistently. Stuon does it automatically from your timer sessions.
How is a study heatmap different from a streak?
A streak counts consecutive days. A heatmap shows every day and how long you studied, so it also shows how much, not only whether.
Related pages
See your own study heatmap
Study in Stuon and the heatmap fills in by itself, one square per day.
See your study heatmapAdd to Chrome, freeor use the free version without an account